Setting Up Xdebug With Laravel Homestead and PhpStorm
- 7 minsOMG, not another guide on setting up Xdebug on Homestead and then getting it to work properly with PhpStorm! Sorry.
I’m writing this as a reminder to myself on how to setup Xdebug on Homestead; I patched this guide together after reading a bunch of answers on Stack Overflow and some posts on various Laravel forums. So after making a few mistakes and breaking my VM several times, here’s the method I figured out…
Installing The Xdebug Extension On Homestead
Xdebug can be installed with apt-get, I think this is the most straight forward method to use since it requires no user interaction. All these commands need to be run by a root user, so you’re best off running sudo su right at the beginning. To get started, run the following commands:
# sudo su
# apt-get install php-xdebug
You can then edit the default Xdebug configuration file and add the required additional settings. You can use whichever editor you like, I’m using Nano and the following command will open up the configuration file for editing with it:
# nano /etc/php/7.0/fpm/conf.d/20-xdebug.ini
Xdebug needs to be remote started when using it with PhpStorm and the default Homestead configuration doesn’t reflect this. So, make sure it contains the following settings:
zend_extension=xdebug.so
xdebug.remote_enable=1
xdebug.remote_connect_back = 1
xdebug.remote_port = 9000
xdebug.max_nesting_level = 250
I actually makes sense to me to enable Xdebug on the CLI too - it seems that PhpStorm checks for Xdebug’s presensence by running php -i on the command line, so if it’s not enabled here then PhpStorm seems to think that it’s not installed. So, to get round this, add the same Xdebug configuration to the following file:
# nano /etc/php/7.0/cli/conf.d/20-xdebug.ini
Once you’re done, you should restart the PHP service on Homestead so the new Xdebug configuration gets loaded. You should also exit from the root user too once you’re finished:
# service php7.0-fpm restart
# exit
You can then double check that Xdebug is installed by running php -i and searching for xdebug. You should be able to see several Xdebug cofiguration values listed.
Getting PhpStorm To Communicate With Xdebug
Update: If you’re using IntelliJ instead of PhpStorm, it’s been reported that you can still follow this tutorial, but you’ll need to first install the “PHP Remote Interpreter” and “Vagrant” plugins before continuining.
Now that Xdebug has been installed on your Homestead box, you can setup PhpStorm to communicate with it. First you’ll need the Vagrant box directory that Homestead is using. You can get this by running the following command:
# vagrant global-status
This should output a table to your console which looks similar to this:
id name provider state directory
----------------------------------------------------------------------------------------
4ff2702 default virtualbox poweroff /Users/ecs/website
1a2b3c4 default virtualbox poweroff /Users/ecs/api-docs
f812a16 default virtualbox running /Users/ecs/Homestead
The above shows information about all known Vagrant environments
on this machine. This data is cached and may not be completely
up-to-date. To interact with any of the machines, you can go to
that directory and run Vagrant, or you can use the ID directly
with Vagrant commands from any directory. For example:
"vagrant destroy 1a2b3c4"
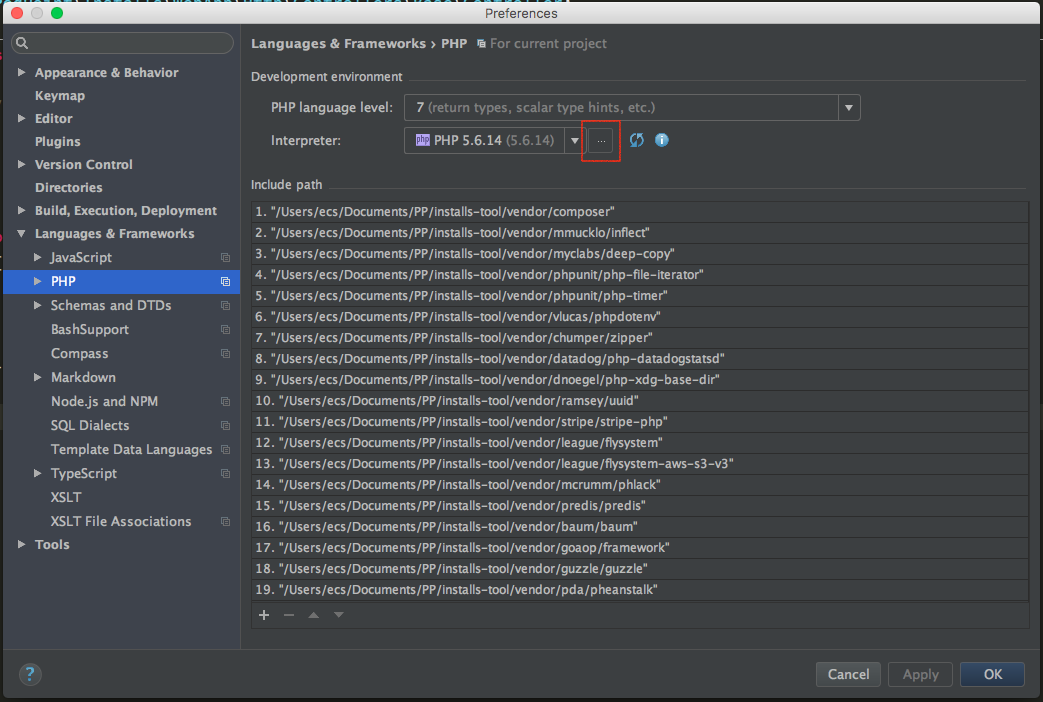
You’ll notice that I have a few Vagrant boxes setup on my machine - we’re looking for Homestead though. It’s quite easy to find since it’s stored in a directory named Homestead. Now you need to open PhpStorm and open Preferences and then navigate to Languages & Frameworks  PHP and select a new interpreter for our project by clicking the ellipsis next to the current setting:
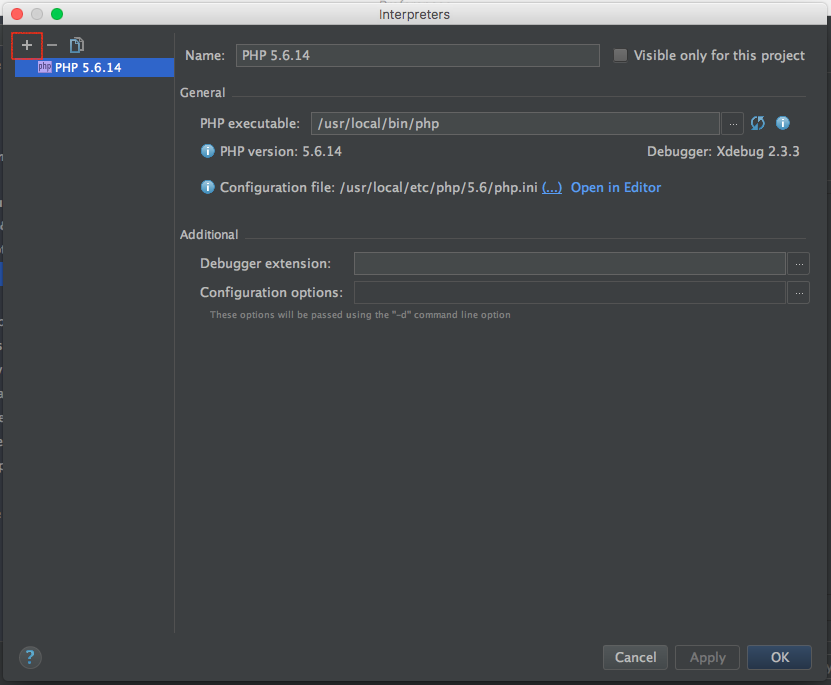
On the next window, you need to click on the ‘+’ symbol in the top left corner to add the new interpreter, you should then select ‘Remote’ from the drop-down which appears:
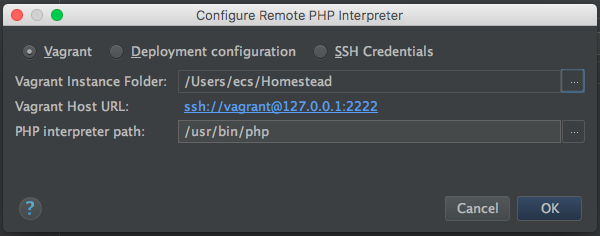
Now another window will open, you need to select the ‘Vagrant’ option and paste in the Vagrant path which you obtained from the console earlier on. Then you can click OK (the PHP interpreter path is the default /usr/bin/php at the time of writing - if this changes in future, it can be obtained by running php -i on Homestead and looking for $_SERVER['_']):
Setting Up A Debug Session In Your Browser
You’ll need to setup remote debugging from your web browser. There’a few ways of doing this, I’ll cover the PhpStorm marklets and browser extensions which are both methods I’ve used myself.
If you visit PhpStorm’s Website then there’s a form you can use which generates a set of bookmarks which you can drag to your browsers’s bookmark toolbar. This is quite a simple approach which I used for a while, but in the end, I didn’t like having a bunch of buttons cluttering up my browser toolbar.
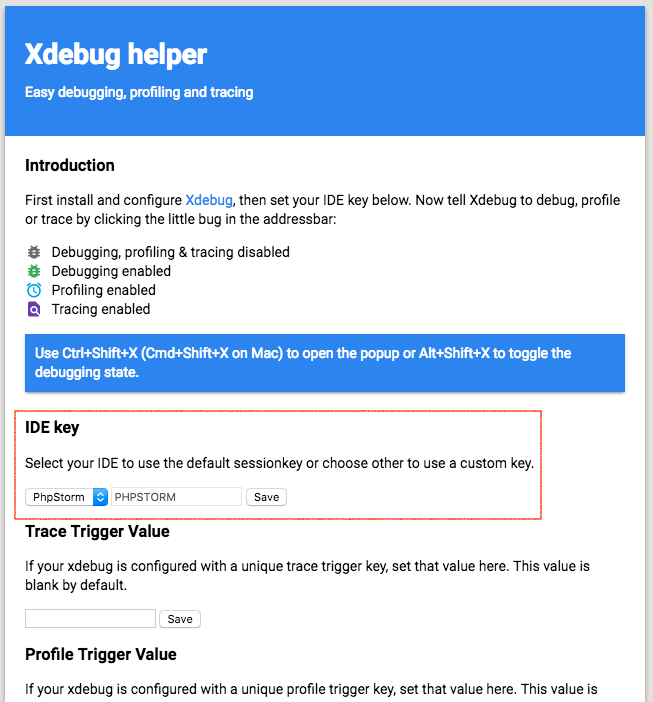
The method I now use is a Chrome extension called Xdebug helper. Xdebug helper adds a small icon to Chrome allowing us to enable and disable debug sessions, profile and trace sessions remotely. Essentially it does the same thing as the PhpStorm marklets, but I find it a whole lot neater!
If you choose to use Xdebug helper then you’ll need to configure it with PhpStorm’s IDE key. After you’ve installed it, make sure you go to it’s options and select PhpStorm under the IDE key section:
Finalising Your PhpStorm Configuration
Now you need to accept an incoming connection from Xdebug in PhpStorm, so enable a debug session in your web browser (if you’re using Xdebug helper, click it’s icon and select ‘Debug’) and refresh your page. A dialog box should open up in PhpStorm which looks like this:
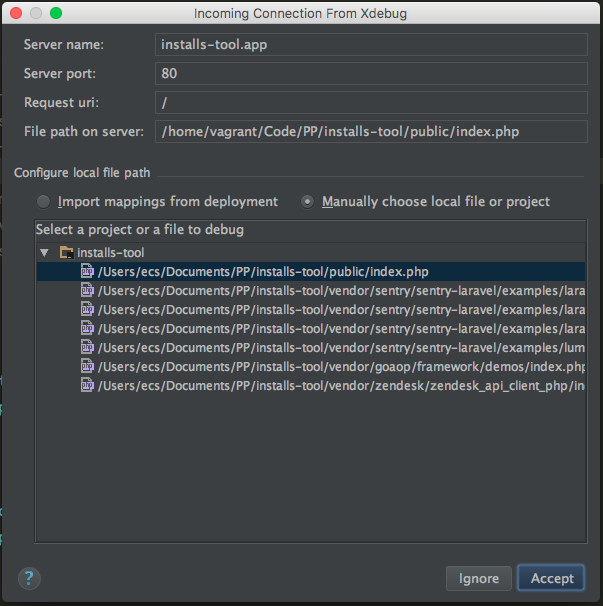
You need to configure PhpStorm so that it can match up the index.php file on Homestead with the local version on your development machine. In the above example, index.php is located in in public so I’d select the matching local version from the list of possible matches file and click accept. Then that should be it!
Nope!
For some reason, PhpStorm has a bit of difficulty matching local paths with the remote ones on Homestead. You’ll probably see this error when you refresh the page after setting up the incoming Xdebug connection:

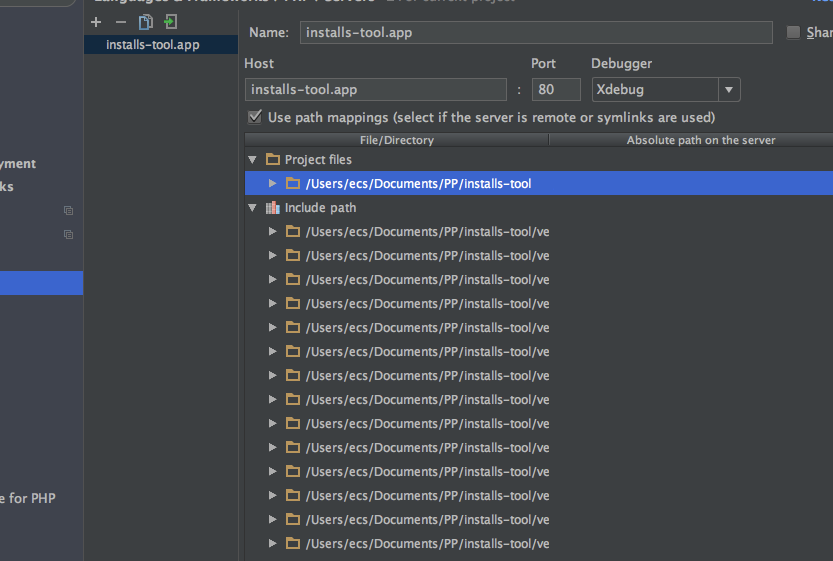
To fix this error, click on the PHP|Servers link on the error message, or go to Preferences PHP Servers and select the server which you defined earlier. You should now see a list of directories, the important one here is under ‘Project files’:
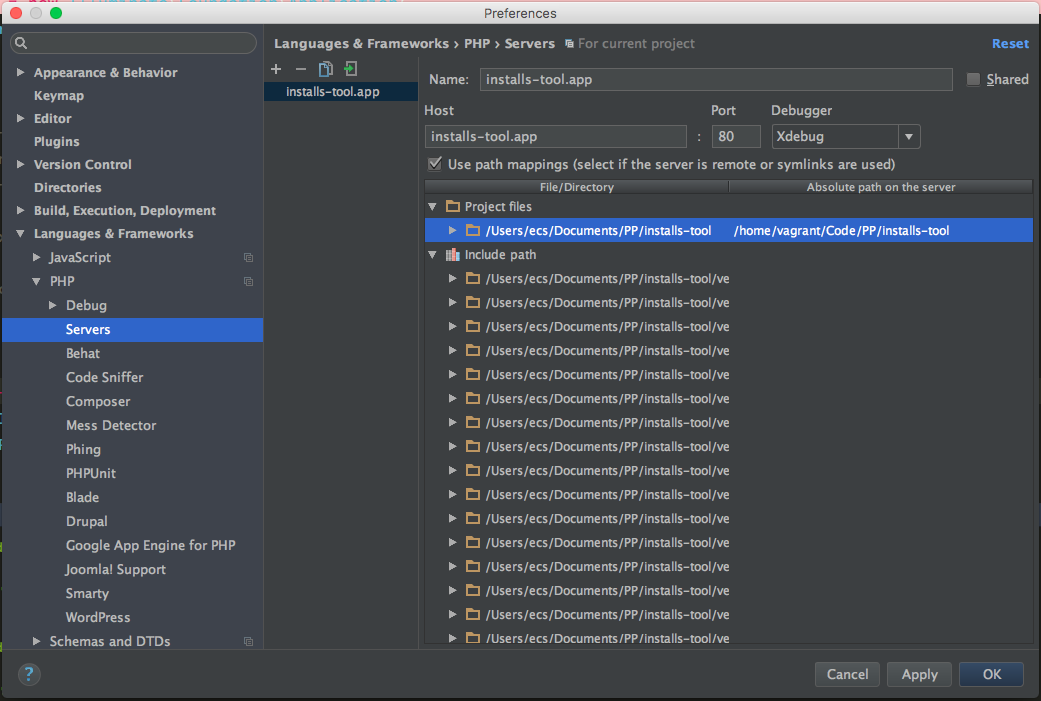
You’ll see that the ‘Absolute path on the server’ is missing, this needs to be filled in with the full location of the corresponding path on Homestead. In this case, my project was located within the default Code directory on Homestead which resides in /home/vagrant/ so the file mapping was /home/vagrant/Code/[project-path] which should be the general configuration for most Homestead users:
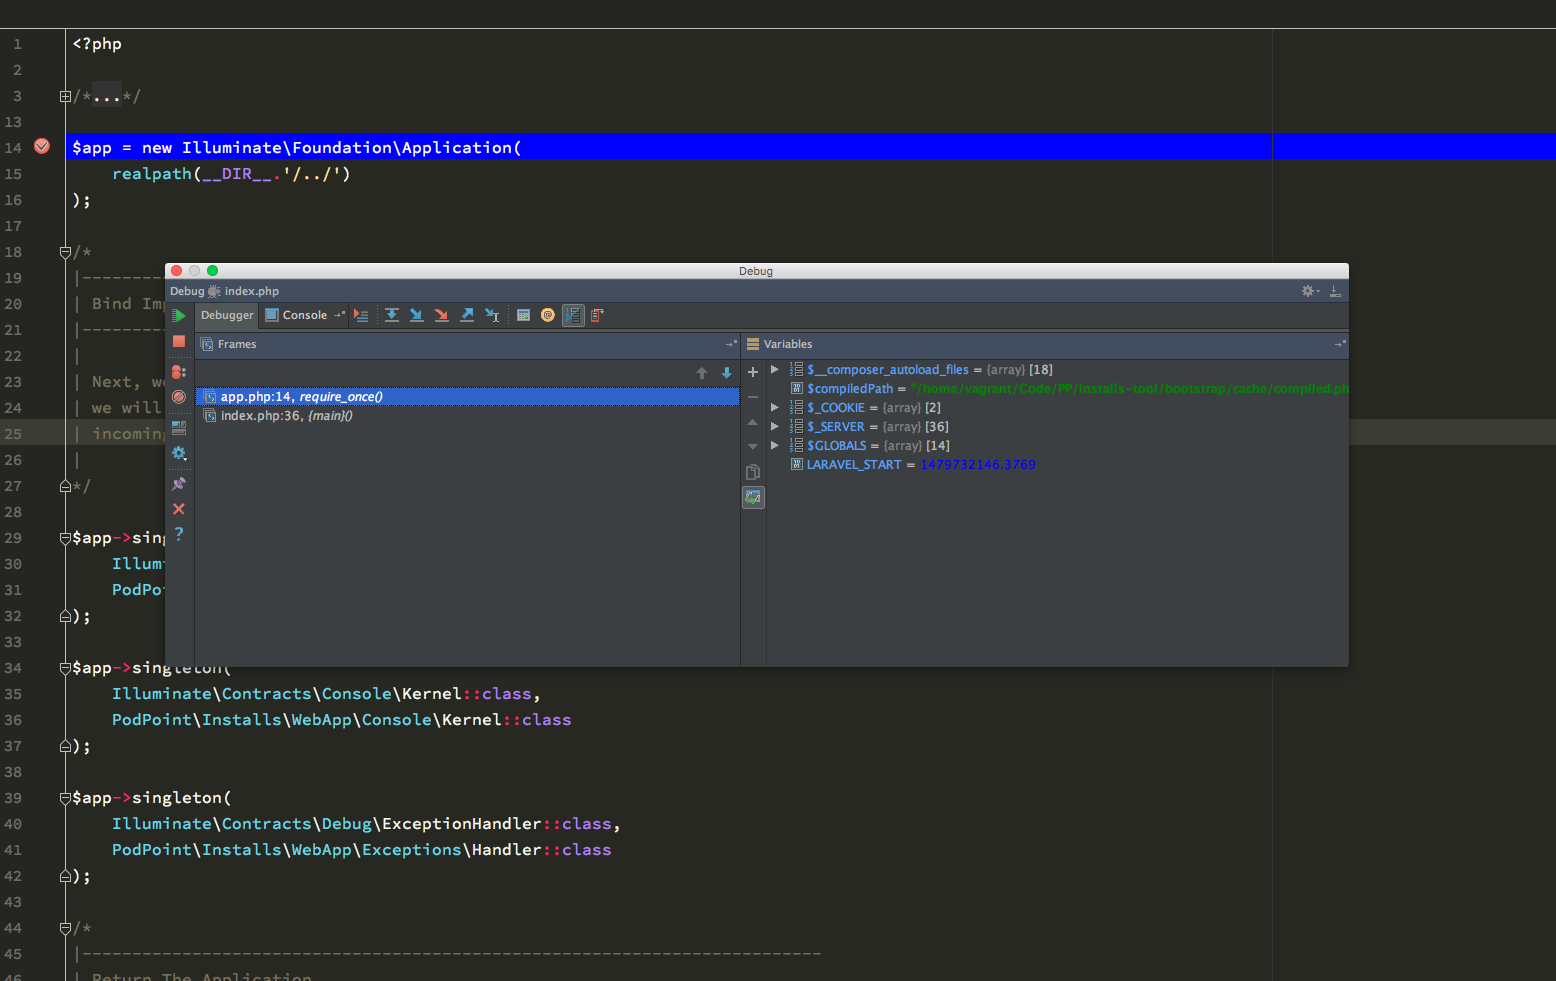
Once this setting has been added and saved, you should be able to add breakpoints in and debug your application. To give it a go, open up a file (I’m using app/bootstrap/app.php) and add a breakpoint, then refresh your page. This is what you should see:
Now you should be ready to start debugging your PHP applications in a completely different way. Sure, dumping variables out is useful, but once you start getting into the habit of adding breakpoints in and viewing variable contents with Xdebug you’ll never look back!
I hope you found this tutorial useful. If you have any issues with it, feel free to report them or fix them 

Edward Coleridge Smith
Independant Software Engineer